For cardiologists, intensivists, & emergency physicians
A subtle change in the pulse can save a life.
The earliest sign of cardiac tamponade (pulsus paradoxus, a respiratory variation in the pulse) has
been measurable since 1873. PulSentry's patented FFT-based algorithm finally automates
it: continuous, on-device detection through any standard pulse oximeter.
PPG · Plethysmographic Waveformrespiratory modulation visible, characteristic of pulsus paradoxus
~700K
US cardiac surgeries annually
STS National Database
48 hr
Mean ED-to-drainage delay in tamponade
Larose et al., Can J Cardiol 2000
0.8–6.2%
Late post-surgical tamponade incidence
Khan et al. 2017; Leiva et al. 2018
11–20%
Mortality when diagnosed late
Zgheib et al., Medicine 2020
Two patients · One missed sign
A condition that kills when diagnosis is delayed.
Cardiac tamponade is highly survivable when caught early, and largely preventable
with continuous hemodynamic monitoring. The patients below were not.
Post-surgical · day 17 post-CABG
Neil Armstrong
2012 · age 82
Bypass surgery to address blocked coronary arteries went well; he was being prepared
for discharge. Pericardial fluid accumulated quietly during recovery, pressurized,
not voluminous. By the time clinicians recognized hemodynamic compromise, the window
for safe drainage had closed. He died from a complication that, found earlier, is routinely survived.
"Tamponade is a medical urgency that becomes an emergency every hour it goes unrecognized."
Pre-symptomatic · workplace setting
Grant Wahl
2022 · age 49
The veteran sports journalist collapsed during a World Cup match in Qatar.
He had been seen by a physician twice in the preceding 48 hours for what was
assumed to be respiratory illness. Cardiac tamponade was identified only at autopsy.
With continuous PPG analysis, the respiratory-cardiac coupling characteristic of
tamponade is detectable hours to days before clinical decompensation.
"The pulse already tells the story. PulSentry listens."
The Diagnostic Gap
A life-threatening condition hiding in plain sight.
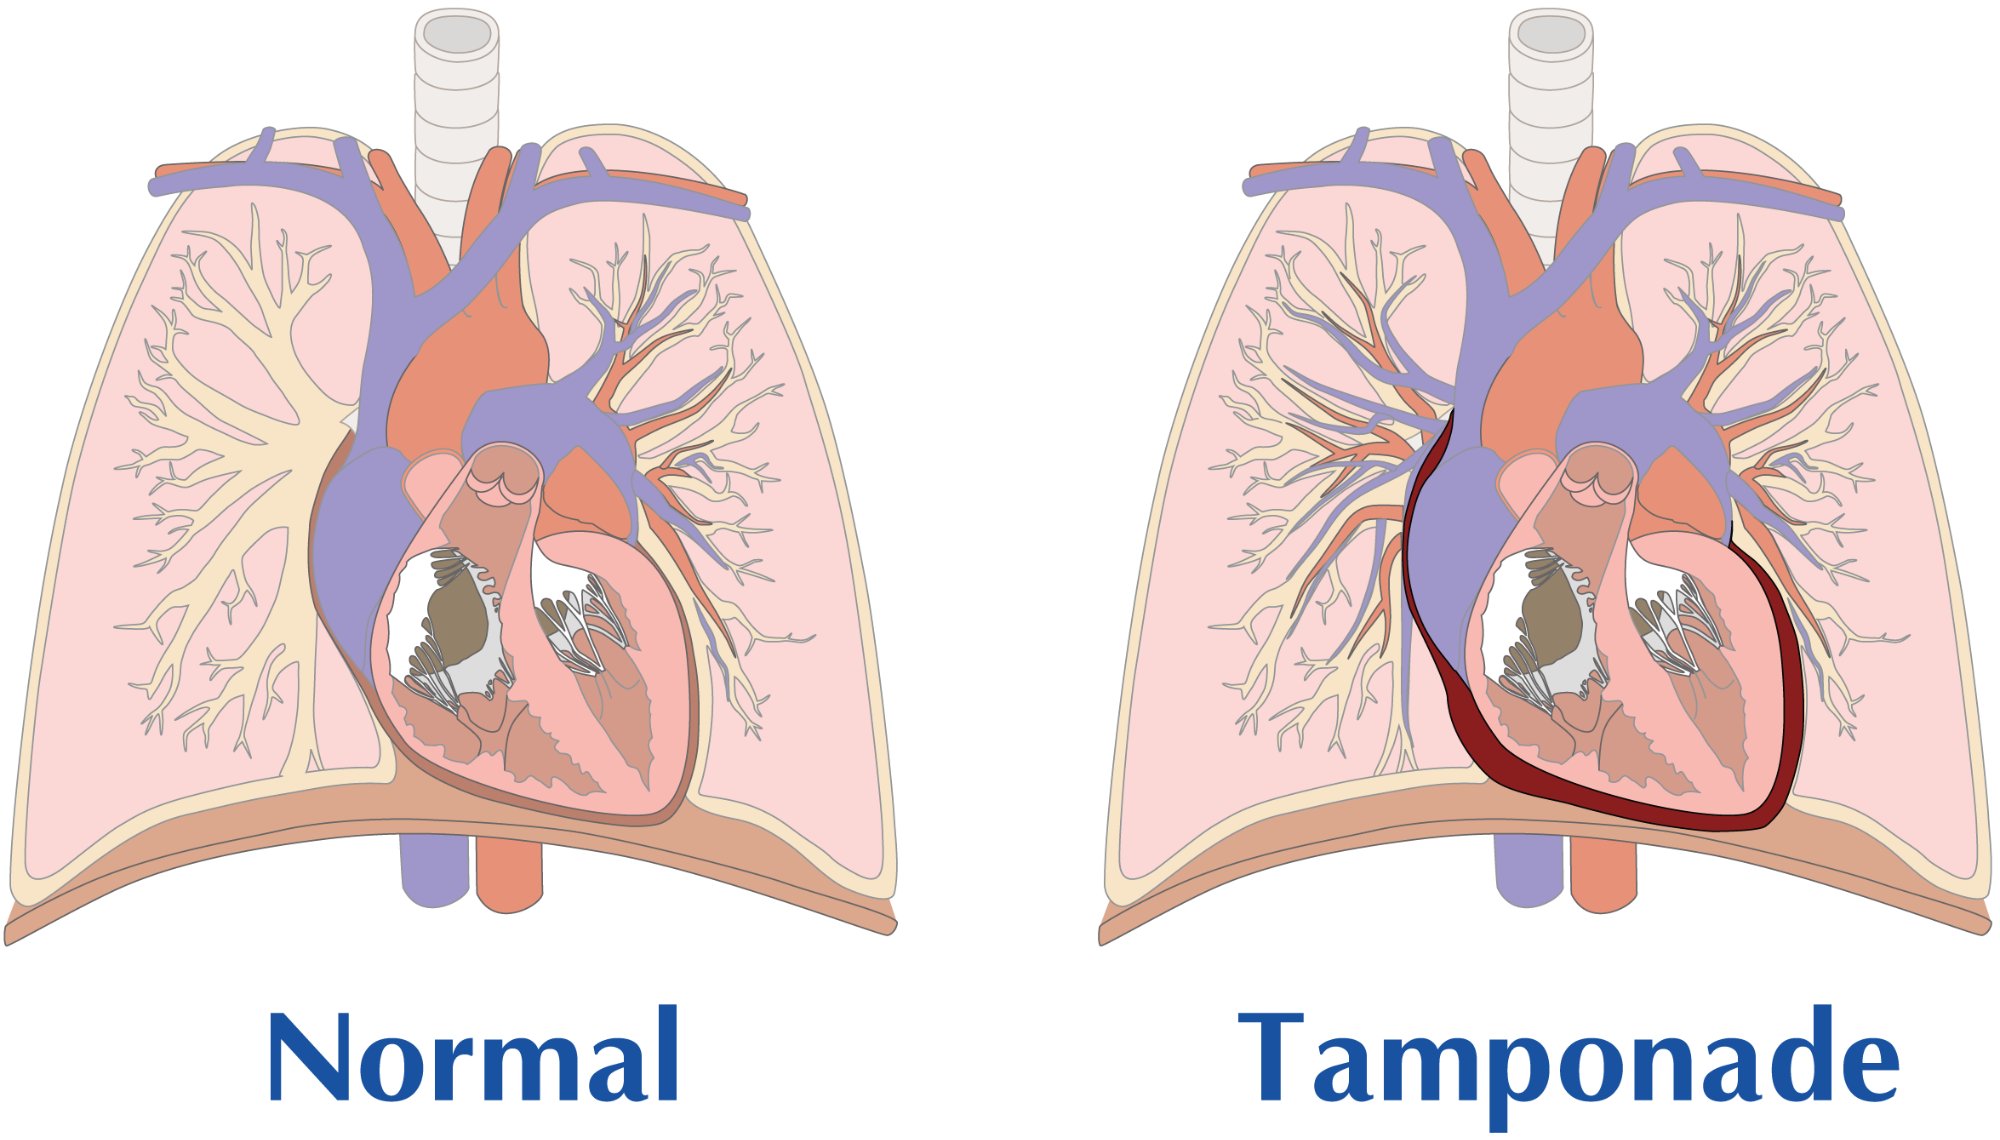
Cardiac tamponade occurs when fluid accumulates in the pericardial space, compressing the heart
and preventing adequate filling. It can develop gradually after cardiac surgery, often after
the patient has been discharged, precisely when monitoring is most limited.
Even small amounts of fluid under pressure can impair heart performance.
Pressurization, not volume, is what causes tamponade.
Normal heart (left) vs. cardiac tamponade (right). The dark region shows fluid accumulation in the
pericardium. Unlike a benign effusion, pressurized fluid compresses the heart chambers, reducing
filling and cardiac output. Animation illustrates progressive accumulation and pressure buildup.
⚠
Why echocardiography misses it: standard echo has only 33% sensitivity
for post-surgical pericardial hematoma, organized blood and clots are acoustically distinct
from the free-flowing fluid echo is designed to detect. Echo provides a snapshot;
pulsus paradoxus is continuous. PulSentry bridges this gap.
While pericardial effusion is common and often benign, the critical distinction is
pressurization of the pericardium. A large, slowly-accumulating effusion
may cause no symptoms, while a small amount of rapidly accumulating fluid can be fatal.
Continuous hemodynamic monitoring, not intermittent imaging, is the key to early detection.
~500Kcardiac surgery patients screened annually
→
~35Kdevelop late tamponade
+
~10KER tamponade presentations
The gap PulSentry fills
To identify the approximately 35,000 patients who develop late tamponade annually,
all ~500,000 cardiac surgery patients must be screened during the post-discharge window,
routine surveillance to find the critical few. Add roughly 10,000 ED tamponade presentations
per year, and the addressable monitoring population is far larger than the diagnosed cases alone.
PulSentry transforms the ubiquitous pulse oximeter into a continuous tamponade screening device,
turning routine post-operative oxygen monitoring into early detection across the entire at-risk population.
Standard of care vs PulSentry
Where the current pathway breaks, and where we change it.
Today, post-surgical tamponade detection depends on the patient noticing symptoms and seeking care.
PulSentry inserts continuous, automated screening into the gap between discharge and decompensation,
without changing what hardware is already at the bedside or in the home.
Current standard of care
Patient-driven detection
ICU monitoring stops
Continuous hemodynamic surveillance ends at discharge, typically days 3–7 post-op.
Day 3 – 7
Symptoms emerge gradually
Dyspnea, fatigue, and exertional intolerance develop slowly over days. Most patients dismiss them as expected post-op recovery.
Day 6 – 16 (peak window)
Misdiagnosis on presentation
Most tamponade patients are first diagnosed with CHF and given diuretics, the opposite of what's needed.
Larose 2000
Diagnostic delay to drainage
Mean 47-hour interval from ED presentation to pericardial drainage. Echo's 33% sensitivity for post-surgical hematoma compounds the delay.
+47 hours
Mortality on intervention
11% with surgical drainage, 20% with pericardiocentesis once tamponade is hemodynamically established.
Zgheib 2020
Net effect: the diagnostic clock starts only when the patient becomes symptomatic, often days into a process that is already hemodynamically advanced.
vs
PulSentry pathway
Algorithm-driven surveillance
Pulse oximeter at home or bedside
Standard SpO₂ probe, clinical-grade or consumer wearable. No new sensor, no new hardware purchase. The PPG waveform is captured the same way it always has been.
Day 0 – 60
Continuous FFT/PSD analysis
The algorithm decomposes the PPG into respiratory and cardiac frequency components in real time, on-device. No cloud dependency.
Every ~12 sec
Tiered confirmation
Transient signals (cough, motion, transient bronchospasm) self-resolve and are filtered out. Only persistent pulsus paradoxus over minutes to hours triggers escalation.
Sustained signal
Clinician alert with context
The treating physician receives the trend, not just an alarm, pulsus index over time, with the underlying spectrum available for review. Clinical action is the clinician's decision.
Hours, not days
Pre-decompensation intervention
Drainage performed earlier in the hemodynamic curve, when the patient is more stable, the procedure is safer, and the mortality risk is substantially lower.
Pre-emergency
Net effect: the diagnostic clock starts when the physiology changes, not when the patient finally calls.
Echo sensitivity (post-surgical hematoma): D'Cruz et al., Circulation 1985.
Diagnostic delay (mean 47 hr) and CHF misdiagnosis pattern: Larose et al., Can J Cardiol 2000.
Mortality: Zgheib et al., Medicine 2020 (138 M ED-patient analysis, ~10,000 with cardiac tamponade).
Peak incidence days 6–16 post-op: Leiva et al., Ann Card Anaesth 2018.
How it works
FFT-based signal processing extracts what the eye cannot see.
PulSentry uses Fast Fourier Transform analysis and Power Spectral Density estimation
to decompose the plethysmographic waveform from a standard pulse oximeter into its constituent
frequencies. Classical signal processing, not machine learning, applied with clinical precision.
In a normal PPG, the cardiac pulse dominates the signal. In pulsus paradoxus, the hallmark of tamponade,
respiratory modulation of pulse amplitude increases dramatically. PulSentry detects this shift by comparing
the respiratory and cardiac frequency peaks in the power spectrum. When the respiratory peak approaches the
cardiac peak, the system flags hemodynamic compromise consistent with tamponade.
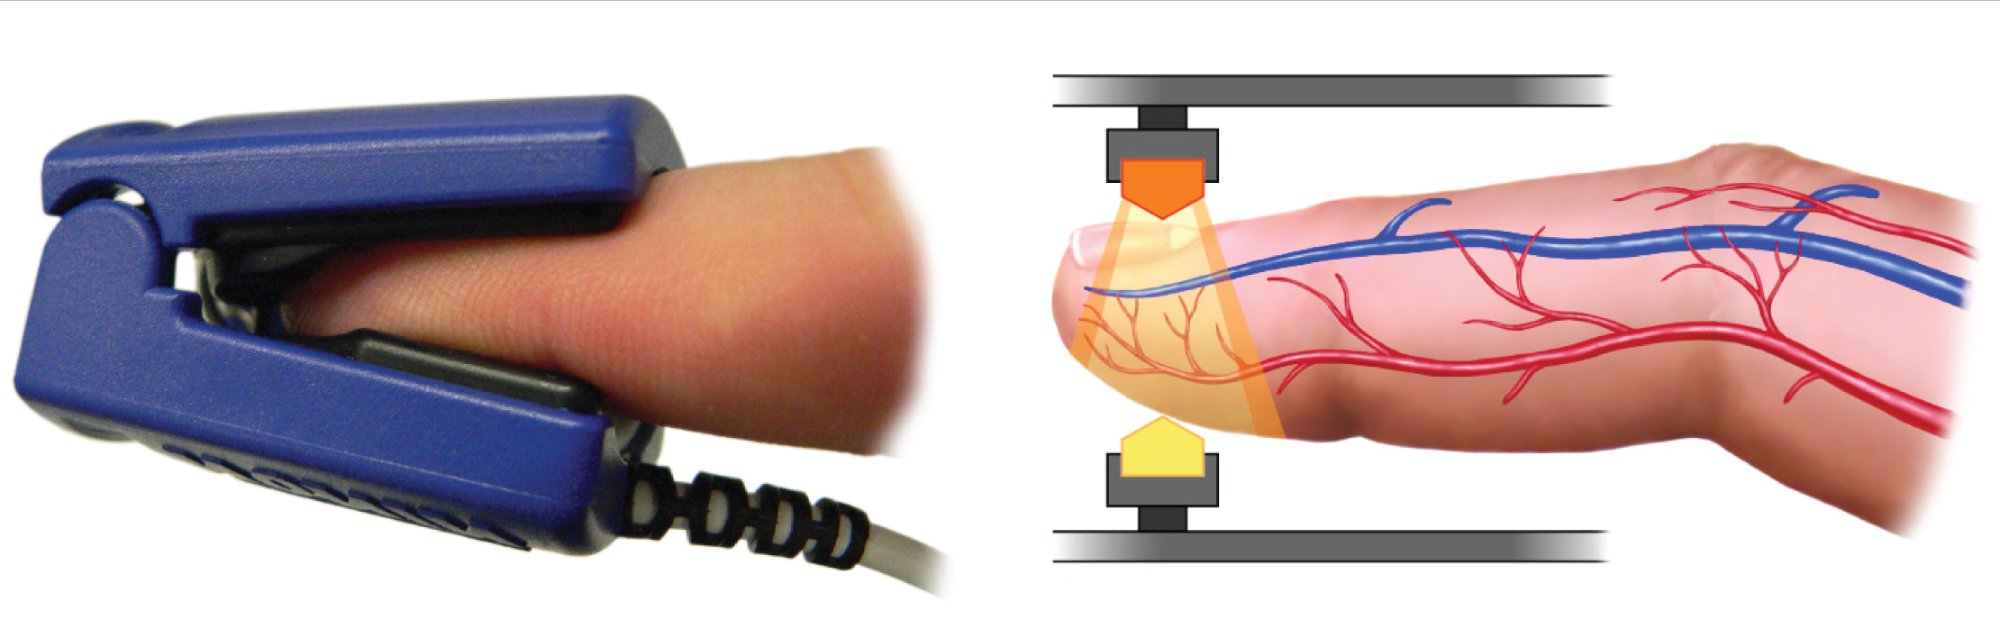
The same arterial pulsation you feel at your wrist reaches the fingertip, and the pulse oximeter
captures it as the plethysmographic (PPG) waveform. This is the raw signal PulSentry analyzes.
No additional hardware required.
01 · Input
PPG Signal
Standard plethysmographic waveform from any pulse oximeter finger probe or wearable.
02 · Transform
FFT Analysis
Fast Fourier Transform decomposes the composite waveform into frequency components.
03 · Measure
PSD Comparison
Respiratory peak height is compared to cardiac peak height in the power spectrum.
04 · Detect
Alert Threshold
Persistent respiratory dominance is flagged as hemodynamic compromise consistent with tamponade.
Interactive · See the spectrum shift
Toggle between a normal PPG power spectrum and one showing pulsus paradoxus. Watch how the respiratory peak
rises until it begins to rival the cardiac peak; this is the signal PulSentry detects automatically.
Pulsus Index (RWP / HWP)
0.18
Algorithm Status
Normal
Multi-channel diagnostic visualization
PulSentry's approach begins with three physiological channels (ECG, respiratory, and plethysmographic),
along with their power spectral densities. This allows distinction of true pulsus paradoxus from confounding
arrhythmias or Traube-Hering-Mayer oscillations.
PPG Waveform
Plethysmographic Signal
Shows baseline oscillation of pulse amplitude across respiratory cycles, the visual signature of pulsus paradoxus.
PPG Power Spectrum
PSD Analysis
Respiratory vs cardiac peak comparison, the primary diagnostic metric. When the respiratory peak approaches the cardiac peak, tamponade is indicated.
ECG Channel
Cardiac Rhythm
Confirms regular sinus rhythm and excludes arrhythmias as a cause of PPG variability.
Respiratory Channel
Impedance Plethysmography
Confirms respiratory rate and validates that PPG oscillations correlate with the breathing cycle.
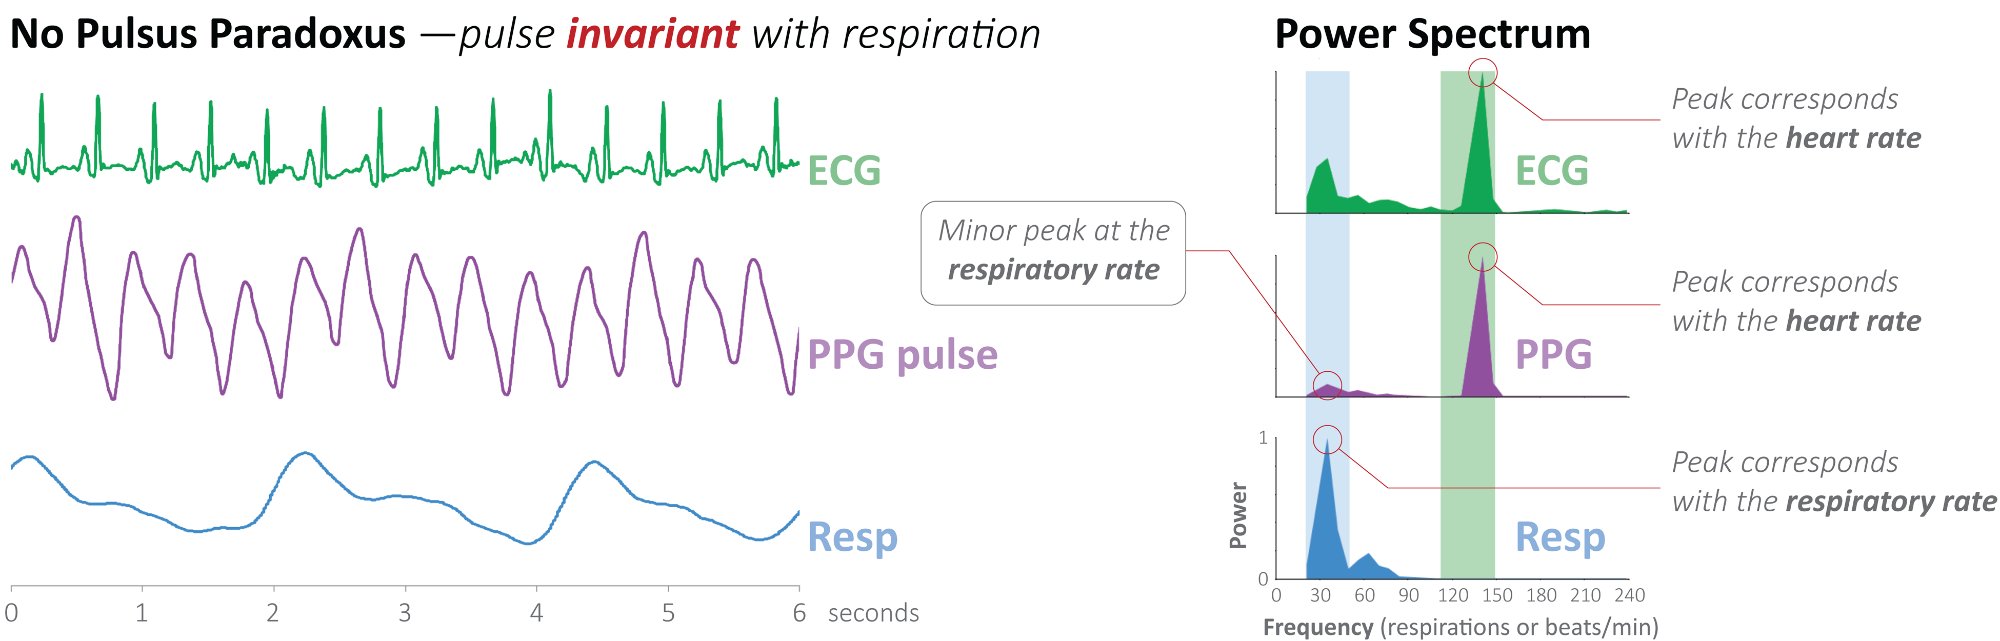
Normal vs pulsus paradoxus, what PulSentry detects
These figures show the key difference: in a normal patient, the PPG power spectrum is dominated by the
cardiac peak. In pulsus paradoxus, a large respiratory peak emerges, the signature of tamponade.
Normal · No pulsus paradoxus
Pulse is invariant with respiration. In the power spectrum, the cardiac peak dominates; the respiratory peak is minor.
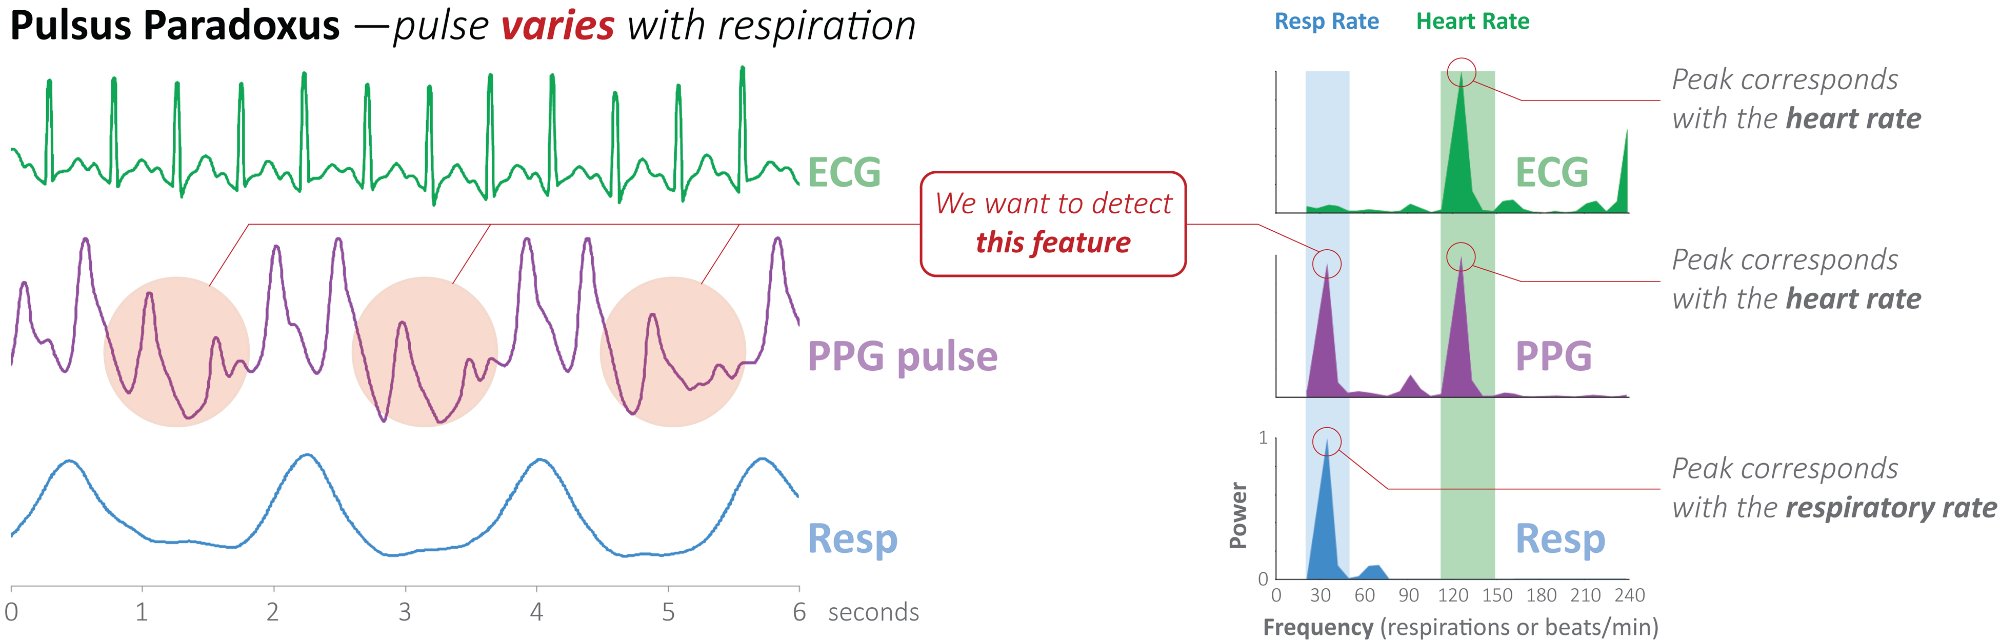
vs
Tamponade · Pulsus paradoxus
Pulse varies with respiration. A large respiratory peak emerges in the power spectrum, approaching the cardiac peak, the signature of tamponade.
The multi-channel approach is covered by US Patent 9,757,043 (PSD/FFT method).
The four-quadrant visualization is a distinctive clinical feature not found in competing approaches.
What about false positives?
A common question: how does PulSentry distinguish cardiac tamponade from other conditions that cause
respiratory variation in the pulse, such as severe asthma, COPD, or mechanical ventilation artifacts?
The answer is persistent pulsus paradoxus.
Transient conditions like bronchospasm or patient movement produce brief, intermittent pulsus paradoxus
that resolves within seconds. Cardiac tamponade produces a sustained, persistent signal
that continues uninterrupted. PulSentry exploits this distinction through a tiered detection approach:
⚡~12 sec
Screening
Initial pulsus paradoxus signal detected in a single respiratory cycle analysis.
→
↻Minutes to hours
Confirmation
Persistent observation over minutes to hours, across many respiratory cycles, eliminates transient causes.
→
!Sustained
Alert
Only sustained pulsus paradoxus consistent with tamponade triggers a clinical alert.
Conditions that mimic pulsus paradoxus (asthma exacerbation, COPD, hypovolemia) typically produce
transient signals that self-resolve. Tamponade is distinguished by the persistence of
abnormal respiratory modulation across minutes to hours, a pattern that PulSentry's
continuous monitoring is uniquely positioned to detect.
A 60-second math primer
What is the Fourier transform doing?
The PPG waveform looks like one wiggly line, but it's actually two waves added together: a fast
cardiac wave and a slower respiratory modulation. The Fourier transform is just a mathematical prism:
it takes the mixed signal and separates it back into its individual frequency components. Click each
layer below to see what's hiding inside.
The PPG you see at the bedside is the SUM of these two waves.
A normal heart beats steadily, and you breathe ~12–15 times a minute. Both physiology happen
simultaneously, and the pulse oximeter records them mixed together. The math separates them.
Anatomy in motion
What tamponade actually does to a beating heart.
The pericardium is a stiff, fibrous sac. When fluid builds up inside it under pressure, it presses in on
the heart. Drag the slider to watch that progression, and to see the fingerprint it leaves on the pulse:
a rising pulsus index, the signal PulSentry is built to detect.
NormalEffusionEarly tamponadeHemodynamic collapse
Stroke Volume100%
Pulsus Index0.18
PulSentry StatusMonitoring
At rest, the pericardium holds only a small amount of lubricating fluid and the heart fills
normally. The pulse is steady from beat to beat, and PulSentry sees a single strong cardiac
peak in the spectrum.
Interactive · live signal
Watch the spectrum become diagnostic.
The same slider that pressurized the pericardium above also drives the PPG signal below. The heart rate and
the breathing rate never change, what grows is the respiratory wave (shown dashed), which adds to
the pulse and swings its baseline up and down. This is the cardio-pulmonary "give and take" of a developing
tamponade. The Fourier transform makes it visible as a respiratory peak rising in the power spectrum, and
PulSentry quantifies it in real time.
Time Domain · Live PPGflat baseline · normal
Frequency Domain · Live PSDcardiac peak dominates
●
Monitoring · normal physiology
Cardiac frequency dominates the spectrum. No action required.
Cardiac peak: present in every normal PPG; reflects heart rate (~1.0–1.4 Hz).
Respiratory wave (dashed): added to the pulse, it swings the baseline up and down. As its amplitude grows it dominates the trace and produces the respiratory peak in the spectrum, the signature of pulsus paradoxus.
Non-respiratory drift: wander from motion or posture, unrelated to the breath cycle, is rejected by the algorithm so only true respiratory coupling is scored.
Validation & Evidence
Published validation of the scientific approach.
The clinical premise, that respiratory variation in the pulse oximeter waveform reliably distinguishes
tamponade from other causes of dyspnea, has already been validated independently in the peer-reviewed
literature. PulSentry's contribution is automation, persistence, and ease of deployment.
Doukky et al.: independent validation
In 2019, Doukky and colleagues at Rush University Medical Center published a study independently
validating the use of pulse oximetry waveform analysis to detect cardiac tamponade. Using a manual
amplitude-ratio method over respiratory cycles, the study achieved:
Metric
Value
Area under curve (AUC)
0.90 (95% CI: 0.84–0.97)
Subjects
74 patients · 19 with confirmed tamponade
At threshold 1.2
100% sensitivity · 44% specificity
At threshold 1.5
80% sensitivity · 81% specificity
At threshold 1.7
80% sensitivity · 89% specificity
Doukky R, et al. "Pulsus Paradoxus Best Predicts the Presence of Cardiac Tamponade Among Patients with
Large Pericardial Effusion." Am J Cardiol. 2019 Feb 1;123(3):498–506.
Important distinction: Doukky used a manual max/min amplitude ratio, a "brute force"
approach. PulSentry's automated FFT/PSD method provides continuous, real-time analysis without manual
measurement. The Doukky paper validates the scientific premise; PulSentry improves the implementation.
Harbor-UCLA prospective validation
A prospective validation study is currently enrolling at Harbor-UCLA Medical Center to test PulSentry's
automated FFT-based algorithm against clinical outcomes, providing the performance data needed for FDA
regulatory submission.
Algorithm performance
The FFT/PSD approach yields an automated, quantitative pulsus index derived from the ratio of
respiratory to cardiac power in the plethysmographic spectrum. The patented method detects progressive
hemodynamic compromise across a range spanning from early to severe tamponade.
Gold-standard comparison
Study design compares PulSentry algorithm output to echocardiographic confirmation and clinical
diagnosis of tamponade. Results will establish sensitivity and specificity metrics required for
FDA 510(k) submission.
Regulatory strategy
A clear, de-risked FDA pathway
PulSentry is positioned as software-based clinical decision support that analyzes data from
already-cleared pulse-oximetry hardware. That framing, plus deterministic signal processing and
established predicate precedent, defines a 510(k) route designed to minimize regulatory risk.
510(k) clearanceSoftware decision support layered on already-cleared pulse oximeters: no new sensor, no new hardware to clear.
Deterministic, lockableClassical FFT/PSD signal processing, mathematically characterized and frozen at submission, avoiding the predetermined change-control burden that adaptive-ML SaMD faces.
Predicate precedentTwo cleared devices establish both pillars: waveform-derived hemodynamic metrics (Masimo K113134) and algorithmic clinician alerts (Viz.ai K180305).
The two predicate devices anchoring the submission:
Masimo Radical-7 · K113134
Plethysmographic waveform analysis for hemodynamic assessment. Establishes the precedent of derived
metrics from pulse oximetry for clinical decision support.
Viz.ai Contact · K180305
Algorithmic clinical alerting based on pattern recognition. Establishes the precedent for software-as-medical-device
generating clinician-facing alerts from automated waveform analysis.
Intended use
"Aid in detection of hemodynamic changes suggestive of cardiac tamponade" for "adult patients at
elevated risk for pericardial effusion." Not a replacement for clinical judgment or definitive diagnostic procedures.
Classical signal processing, not machine learning, simplifies validation. The FFT/PSD method is well
characterized mathematically, deterministic, and can be locked at submission. This avoids the "predetermined
change control plan" complexity that adaptive ML algorithms face under FDA's evolving SaMD framework.
The patient journey
From discharge to protected, in one continuous signal.
A typical post-cardiac-surgery patient leaves the hospital around day five. Continuous monitoring stops.
For the next 4–8 weeks, the patient is at peak risk for late tamponade, but invisible. PulSentry runs
in that gap.
01
Pulse oximeter goes home with the patient
Standard fingertip device, same hardware already used millions of times daily. Patient wears it nightly during sleep + on demand for spot checks.
02
Algorithm runs on-device, 24/7
PSD analysis every ~12 seconds. No video upload. No cloud dependency. The pulsus index trend is what gets sent to the care team.
03
Trend, not alarm
The clinician sees a quantitative trend over days, not a single "alert!", context they can interpret. Persistent rise means action; transient blips do not.
04
Decision in clinical time
Order an outpatient echo. Bring the patient in. Drain electively before hemodynamic collapse. The same intervention, performed earlier, safely.
Where it runs
A software algorithm, so it runs anywhere a pulse oximeter does.
Because PulSentry is computed entirely from the PPG waveform, and runs on-device with no cloud dependency,
it deploys on hardware ranging from ICU monitors to consumer wearables. The same algorithm, the same
mathematical guarantees, four very different physical platforms.
Hospital Monitors
Bedside ICU and step-down monitors with PPG output (Masimo, Philips IntelliVue, GE Carescape).
Phase 1
Home Pulse Oximeters
FDA-cleared fingertip oximeters used for post-discharge cardiac surgery monitoring under RPM codes.
Phase 1
Smartwatches
Apple Watch, Samsung, Fitbit, Oura: all compute PPG on the wrist. The signal is the same physiology PulSentry analyzes.
Future · partner
Smartphones
Phone-camera PPG via the rear LED & sensor (Samsung S-Health, Google Fit) provides a second opportunistic capture path.
Research
★
Why this matters clinically: the highest-risk window for late post-surgical tamponade
is days 6–16 post-op, after discharge, when patients are no longer on continuous
monitors. PulSentry's hardware-agnostic design means continuous screening can follow the patient from
the OR to the wrist to the home, without ever requiring a new physical device. The algorithm travels
with the signal.
Intellectual property
Three granted US patents protect the core technology.
PulSentry's portfolio covers both the time-domain (waveform analysis) and frequency-domain (FFT/PSD)
approaches to detecting pulsus paradoxus from plethysmographic oximetry. The foundational patents
established the initial detection methods; the breakthrough was the introduction of
Power Spectral Density analysis via FFT in the most recent patent. All three patents
are assigned to the Lundquist Institute at Harbor-UCLA.
Method and System for Detection of Respiratory Variation in Plethysmographic Oximetry
Filed Dec 5, 2008 · Granted Mar 6, 2012
Covers: time-domain waveform analysis, offset/amplitude scoring (H/A ratio) for detecting pulsus
paradoxus from PLETH baseline oscillations. Inventors: Gregory R. Mason, John M. Criley.
System Claims for Respiratory Variation Detection in Plethysmographic Oximetry
Filed Feb 24, 2012 · Granted Jun 18, 2013
Divisional of US 8,128,569. Covers: system architecture: database, monitoring devices, waveform
analysis module, and alarm triggering. Inventors: Gregory R. Mason, John M. Criley.
FFT/PSD Method for Respiratory Variation Detection in Plethysmographic Oximetry
Filed Jun 17, 2013 · Granted Sep 12, 2017 · Expires ~April 2029
Continuation-in-part. Covers: Power Spectral Density analysis via FFT, respiratory-to-cardiac
peak comparison, area-under-curve comparison, and multi-channel cross-validation. Inventors: Gregory R. Mason,
John M. Criley, Stuart R. Criley.
IP strategy
The foundational patents (US 8,128,569 and US 8,465,434) established the initial time-domain waveform
analysis approach. The breakthrough, US 9,757,043, introduced the Power Spectral
Density method via FFT that is the basis of PulSentry's current technology. This primary patent
protects the frequency-domain analysis, multi-channel cross-validation, and the system architecture
for continuous automated monitoring. Additional trade secret protection covers specific algorithm
thresholds, noise-reduction techniques, and the four-quadrant diagnostic visualization methodology.
Reimbursement
Built on established Medicare RPM codes.
PulSentry leverages the existing Medicare Remote Patient Monitoring framework. No new CPT codes are
required. The 2026 CMS Physician Fee Schedule provides clear billing pathways for continuous
physiological monitoring using FDA-cleared devices.
CPT Code
Description
2026 Rate
Frequency
99453
Initial device setup & patient education
$22.00
Once per patient
99454
Device supply with ≥16 days daily recordings
$47.06
Monthly
99457
Remote monitoring treatment (first 20 min)
$52.00
Monthly
99458
Remote monitoring treatment (additional 20 min)
$41.00
Monthly · unlimited
99445
Device supply with 2–15 days recordings [New 2026]
$47.00
Monthly
Rates are national non-facility averages from the 2026 CMS Physician Fee Schedule Final Rule. Actual rates
vary by geographic region. CPT 99445 is a new code for 2026 covering shorter monitoring periods (2–15 days).
$99–162
Estimated revenue per patient per month from established RPM codes alone, based on
device supply plus the first 20 minutes of clinician monitoring time.
With ~500,000 cardiac surgery patients requiring post-discharge screening annually over a 30–60 day
monitoring window, PulSentry creates substantial recurring revenue using existing Medicare RPM
codes, the screening population, not just diagnosed cases, drives the model.
Facility / program model
Hospitals can also license PulSentry as part of an in-house cardiac surgery monitoring program,
facility-based contracting analogous to the Siemens / Philips equipment-rental model. Predictable
ARR for the health system; no per-patient billing complexity.
Target market: phased
Phase 1 · Post-cardiac surgery
~500,000 US cardiac surgery patients/year require post-discharge screening; ~35,000 develop late tamponade.
Clear clinical pathway, defined 30–60 day monitoring period, measurable outcomes. An additional ~10,000 ER
tamponade cases expand the addressable population.
Phase 2 · Expanded cardiac
Patients with known pericardial effusion, post-catheterization, oncology patients on cardiotoxic therapy,
valve replacement follow-up, TAVR/SAVR populations.
Phase 3 · Broader applications
Pulsus paradoxus is not unique to tamponade; it appears in severe asthma, COPD exacerbation, tension
pneumothorax, and obstructive sleep apnea. PulSentry extends naturally to ER triage for undifferentiated
dyspnea (4M+ US presentations/year), inpatient respiratory deterioration monitoring, and home-based screening.
Team
Cardiology, signal processing, & device commercialization.
PulSentry brings together clinical investigators, signal-processing expertise, and medical-device
commercialization experience. The technology was invented at Harbor-UCLA and continues to be developed
in close collaboration with Lundquist Institute investigators.
Gregory R. Mason, MD
President · Co-founder
Pulmonary & critical care clinician. Co-inventor on all three PulSentry patents. Authored the foundational clinical observations connecting respiratory PPG variation to tamponade physiology.
Frederick M. Haney, PhD
Executive Chairman · Co-founder
The seasoned-CEO hand early-stage companies need. Founder of 3i Ventures California: $80M deployed across 60 companies, 19 IPOs, top-quartile returns. Interim CEO of NovaDigm Therapeutics; board roles behind exits including Parcel Pending ($100M). Author of The Fundable Startup. PhD, Carnegie Mellon.
Stuart R. Criley, MBA
Software Architect
Johns Hopkins. Built interactive medical software for Genentech and Boston Scientific. SBIR/STTR grant experience. Co-inventor on US 9,757,043 (PSD/FFT method).
Eamonn Keogh, PhD
Time-series Algorithms
Distinguished Professor of Computer Science & Engineering at UC Riverside and a leading authority on time-series data mining. Advises on algorithm design, validation methodology, and feature extraction.
Lineage note: the technology traces back to John M. Criley, MD, the late cardiologist
whose career-long observation of paradoxical pulse phenomena seeded the original patents. PulSentry
carries that work into automated detection.
Try it yourself
A back-of-envelope Remote Patient Monitoring revenue model.
Remote Patient Monitoring (RPM) is how a hospital or cardiology practice is reimbursed for continuous
post-discharge monitoring. Drag the sliders to estimate the annual revenue a provider that deploys
PulSentry could bill under standard Medicare RPM coding for one cardiac-surgery service line. This is
revenue for the adopting customer, not for PulSentry. Built on 2026 CMS Physician Fee Schedule rates.
Illustrative; actual rates vary by region, payer mix, and time billed.
501,0002,0003,000
1 mo2 mo4 mo6 mo
20 min40 min60 min
Annual revenue to the provider$71,030Billed by the adopting provider under established CMS RPM codes · before clinician share
99453Initial setup$11,000
99454Device supply / month$47,060
99457First 20 min monitoring / month$52,000
99458Additional 20-min increments$0
Note: illustrative model, not financial guidance. Actual reimbursement depends on
site of service, geographic adjustment, payer mix, time documentation, and qualifying device-day
coverage (≥16 days for 99454, 2–15 days for new 2026 code 99445).
Side by side
Same patient. Two trajectories.
The mortality difference between caught-early and caught-late tamponade is enormous. Drag the divider
below to compare what a 14-day post-discharge window looks like with and without continuous PPG
screening. The signal is the same; the response time is different.
Without PulSentry
With PulSentry
*Mortality reduction estimate based on shifted distribution from late (11–20% mortality) to elective
drainage (<3% mortality). Drag the handle to compare. Data from Zgheib 2020 and standard cardiac
surgery outcomes literature.
The economics
Catching it early saves money, not just lives.
The clinical case and the financial case point the same direction. A late presentation drives an
unplanned readmission, ICU time, and an urgent procedure. Detecting the same patient early shifts
them to a planned, lower-acuity pathway, and the monitoring that makes that possible is itself
reimbursed. The numbers below are illustrative and order-of-magnitude, meant to show the direction
and scale rather than a precise quote.
Late · emergency pathway$30k–50kestimated cost per episode
Unplanned 30-day readmission plus ICU stay
Urgent pericardial drainage or surgical re-exploration
11–20% mortality once decompensation has begun
Counts against CMS readmission penalties (HRRP)
Early · elective pathway$8k–15kestimated cost per episode
Planned, catheter-based drainage at lower acuity
Shorter length of stay, little or no ICU time
Under 3% mortality with elective management
Monitoring is reimbursed via RPM, so it is a revenue line, not a cost
Net to the health system~$20k–35kavoided cost per prevented late event
Plus recurring RPM revenue for every monitored patient
Plus reduced exposure to readmission penalties
Plus the downstream costs of decompensation that never occur
For investors. Roughly 500,000 U.S. cardiac-surgery patients enter the post-discharge
screening window every year. Even a modest reduction in late tamponade across that population is a
large pool of avoidable cost, and it sits on top of a recurring, software-margin RPM revenue stream
layered onto hardware that is already FDA-cleared. The incentives line up across every stakeholder at
once: patients avoid a life-threatening emergency, providers cut cost while capturing reimbursement,
and payers avoid the most expensive episodes of care. That alignment, not any single number, is the
investment thesis.
Illustrative model, not financial or clinical guidance. Episode-cost ranges are order-of-magnitude
estimates drawn from cardiac-surgery readmission and pericardial-intervention cost literature;
mortality figures from Zgheib 2020 and standard cardiac-surgery outcomes data. Actual figures vary by
institution, payer mix, geography, and the specifics of each case.
Get in touch
Bring tamponade detection to every pulse oximeter.
PulSentry is seeking clinical collaborators and strategic partners to bring this technology to market.
The algorithm runs on standard pulse oximeter hardware, making integration possible with existing
clinical-grade monitors, hospital systems, and consumer wearables.
For cardiologists & ED physicians
Interested in joining the prospective validation cohort, or in implementing PulSentry-based screening
at your institution? We're actively recruiting clinical sites and individual investigator collaborators.
For health systems
Deploy PulSentry as part of a post-discharge cardiac surgery monitoring program. Established RPM
reimbursement codes provide immediate revenue with measurable clinical value, reduced readmissions,
earlier intervention, lower morbidity.
For device manufacturers
License PulSentry's patented algorithm for integration into existing pulse oximeter hardware or
consumer wearables. On-device signal processing, no cloud dependency. Compatible with clinical
monitors and consumer-grade PPG sensors.
For investors & strategic partners
A software-margin product layered on already-cleared hardware, a de-risked 510(k) pathway, an issued
patent portfolio, and a seasoned board. We welcome conversations with investors and partners who want
to help close this diagnostic gap at scale.